


The Big Picture
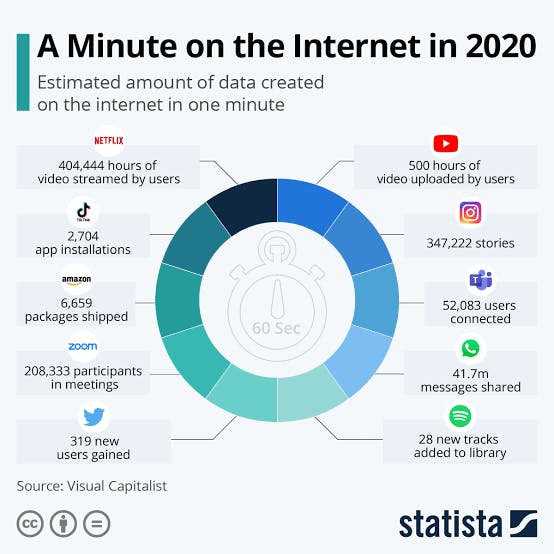
In my post on the green potential of event driven architectures and AsyncApi I noted that in 2022 4.8 zettabytes of data will be transferred over IP addresses. More than all data transferred in the previous 32 years since the Internet was launched. I gave a high level overview of how to estimate the quantity of CO2 emissions generated by API data traffic, and particularly REST APIs. Using the most conservative, lowest estimate of CO2/gigabyte I could find, I arrived at a figure equivalent to driving all the cars in Shanghai for a year. Which would need the equivalent of doubling all the trees in Ireland. Every year. Plus annual, exponential increases on top of that.
So this is the Big Picture we need to keep our focus on, which can be summarised as:
- The more data we transmit or consume, the greater our digital carbon footprint
- The amount of data currently transmitted is a significant contributor to climate change
- Anything we can do to reduce data transmission, in volume, frequency or duration, through greener infrastructure, architecture and back-end and front-end design patterns such as green by default; and green mode design, we should do to shift the current dismaying climate trends.
At a more granular level however the Big Picture above is your motivation and theory of change, but it's not enough to translate vision into measurable objectives.
The challenge of measurement
Use cases
You need some kind of unit of measure for benchmarking your product's current digital emissions in order to monitor and measurably improve them. This could be purely at engineering team level, incorporated into your CI pipeline to stay within a carbon budget in your ticket implementations; or it could be part of a company wide digital Lifecycle Analysis (LCA), environmental management systems (EMS), or B Corp certification process.
So how much CO2 is generated by 1GB of data? This is a case in which why you measure is more important than how you measure.
Focus on the why
Bearing in mind the Big Picture above, you benchmark in order to make measurable progress, and choose a metric in order to monitor and communicate that progress. What really matters in most cases, is not so much the precision of your unit, but the trajectory of your product and organisation.
Not to say that the precision of your measurements isn't consequential, or that expert disagreement on exact bounds or ranges mean there are no bounds or ranges you need to follow to remain rooted in evidence!
But it is to say, that for most organisational purposes, as long as you are within the ranges indicated by reputable science (meaning pick a scientifically backed metric, even if it differs from another scientifically backed metric), the precise calculus of your units of measurement is less important than how much and how fast your emissions are improving (or worsening).
Much better to have a measure that turns out to be 10% inaccurate to quantify a 50% annual improvement in emissions, and consistent progress over 5 years, than a measure with superior exactitude demonstrating 10-20% more emissions every year over the same 5 years.
Having said that, there is no exact and constant GB/kWh/CO2 correspondence, which is why there is quite a bit of scientific and policy debate in terms of arriving at precise figures.
Calculating data emissions.
Global averages
The most conservative recent figure is 0.015 kWh per GB by McGovern, and 0.0042 kg of CO2 per GB. The International Energy Agency (IAE) estimated in 2020 a 0.06 kWh/GB and 0.478 kg CO2/kWh footprint, which would result in 0.028 kg of CO2 per GB streamed.
So that shouldn't be too difficult right? Just choose one of the metrics above, and start calculating your CO2/GB benchmarks. Except, it is a bit more nuanced than that, if you're after precision.
Hardware factors
There is a difference in the emissions of the same GB of data by device type (e.g. mobile or PC), and by signal type (e.g. 3G, 4G, Wi-Fi) with emissions calculated at 0.1-0.2 kWh/GB for 4G mobile, so a lot more than the average metrics above.
It follows that if your product involves the Internet Of Things the intensity per GB will likewise vary if you're using a smart watch, a fridge, smart glasses, or an implant in your leg.
Problem is, once you've accounted for device type, not all device brands and and models within each device type are created equal, so depending on the age, brand and model your 1GB might produce completely different emissions.
Likewise which data communication protocol (e.g. HTTP, USSD, MQTT your device uses to transmit the same 1GB of data to your device will affect the emissions it emits.
Got it. So if we just apply different CO2/GB metrics per device type, per signal type and per communication protocol, then, as the Brits disconcertingly say: Bob's your uncle. Now can we go measure?
Software factors
Well, say you have 2 identical devices running on the same signal type via the same communication protocol. Different configurations, software installed, operating system, etc. will affect the electricity consumption of that identical machine upon receiving 1 GB of data.
It will be very different browsing on a minimalist Linux distribution like Porteus which is small enough to fit in an old USB stick and run entirely from system RAM, while browsing your 1GB of data using a text based browser in your terminal; than it is to browse 1GB of data on a Windows OS opening 100 Chrome tabs while having 10 desktop applications running in the background.

So let's imagine you have 2 identical machines, identically configured, in identical conditions, with identical hardware and software running. Will your elusive GB now be equivalent?
Use case factors
Well actually, no. There is also a difference in emissions according to what user behaviour that GB of data is meant to elicit.
1 GB has been estimated to be equivalent to 600 web pages, or 30 minutes of HD video (caveat emptor: previous paragraphs apply!). By now, you've read enough to be pretty sure that your identical quantity of data will produce different emissions in these two scenarios... but can you guess whether 30 mins of data and CPU intensive video or 600 super optimised web page visits is worse for the climate?
If we take an average time spent on a web page to be 52 seconds (varies hugely between industries and between websites), then 600 pages is around 8 hours on your machine viewing the screen. That is 16 times longer than a 30 minute video.
Imagine that 30 minute video was transmitted in HD, not hosted in a green cloud provider, no steps taken to optimise delivery. Meanwhile those web pages were downloaded in a single optimised request via a super optimised CDN from a green cloud provider. Clearly the emissions generated by the GB of video traffic would be incomparably higher than those of your fantastically opitimized and delivered 600 pages.
Except, all that reckless, high emission, 30 minute video traffic, would STILL use less electricity than keeping your computer monitor, CPU, background processes, etc, in use for 8 hours.
Taking everything into account so far, and inaccurately working from a global average electricity mix, streaming a GB of video will produce around 18g of CO2. In contrast, a laptop that has a life of three years will generate, including embodied carbon, 107g of CO2 per hour of use, so 828g of CO2. Nearly 50 times the 30 minute video's footprint for a single GB of data.
So now we're there, right? You just have to use the same machine to stream the same 30 minute video over the same network for your 1GB of data to translate into a single CO2 emissions metric.
Not by a long shot!

Grid intensity
The emissions of your extremely frustrating GB will vary in relation to the location and time at which you stream your 30m video, even on the same device over the same network and protocol, hosted in the same server.
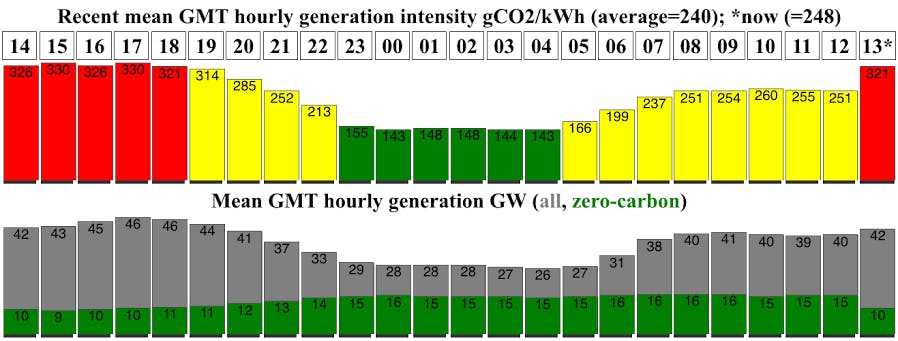
Emissions fluctuate in accordance with the intensity of the electricity grid at the time you stream a video. Your GB will produce more emissions when the grid is at high intensity, and less when the grid is being powered by renewable resources, so the same GB of data will produce more or less CO2 at a different time of day. There's a variety of APIs, like Electricity Maps (global), carbonintensity.org.uk (UK) and many many more, that you can use to measure your emissions in relation to grid usage, and make your websites and applications not just carbon aware but carbon intelligent.
An example of one implementation is the fantastic branch.climateaction.tech website. If you look top right, you will see it has 4 performance modes, giving you most functionality at low grid usage times, and reducing the defaults at high grid intensity times. So in low grid intensity mode you get full colour images displayed by default; in moderate you get them monochrome, and in high usage mode you have to click in order to see the image. The "Live" mode automatically switches between modes depending on grid intensity.
You can see how branch magazine uses the UK grid api to measure intensity in this simple JavaScript file.
Another implementation would be Code Carbon which is more granular and calculates not just the emissions of your website or application in aggregate, but of your actual code, in relation to grid intensity. This allows you to create carbon aware queueing jobs, which basically allocate the most computing intensive jobs to the lowest grid intensity times.
Track to improve, gradually refine
So is there then one answer to the question of how many CO2 emissions are in 1 GB we can use as a consistent metric?
Alas no.
Which is to say, tools like Ecograder recommended in my earlier posts give you a nice starting point to benchmark and communicate your progress, but if you want to be thorough and maximally impactful, you need to drill down much more in both your measurements and implementations, with the tools and examples I've offered.
The most important thing, of course, is that whatever metrics and tools you choose (quick and dirty or orchestrated and precise), they help you surface your direction of travel in emissions, and empower you to reduce them month on month, year on year.
And just as you can improve your emissions year on year, you can also year on year improve the precision of your measurements, adding increasingly precise metrics, and increasingly smart automations built on those.
What you can do
As technologists, each of us can have disproportionate impact, because the technologies we work on tend to affect thousands, and sometimes millions of people. So every one of us who tweaks a product in a climate friendly way, can add up to a collective contribution that actually makes a difference.
If you're keen on being an environmentally responsible technologist, but you're not sure where to start, head over to my pinned starter toolkit post which will give you a good base to begin this journey.
If you're experienced but would like to grow your community of sustainable practice, and be exposed to new tools and design patterns, that toolkit includes leads you can follow to repos, slack groups, and resources.
The scope for action is huge. We just need to take a first step, and keep on walking.